Discover the importance of benchmarking, regularity, intersectionality, and the relationship your organization has with its diversity data in this extract from our recent guide ‘5 Key Strategies to Accelerate the Momentum of Your Diversity, Equity, and Inclusion Program’.
To make progress, you need to be measuring progress. ”What gets measured gets done”, as the saying goes. Monitoring diversity and inclusion programs is the best way to measure success—or to establish the lack thereof. This enables you to determine what is and isn’t working and what therefore needs to be modified.
Establishing Regularity and Benchmarking
To this end, your overarching goals should include a component that allows for regular checkups. Establishing a cadence of review for your program goals and data accounts for the fluidity of diversity, equity, and inclusion (DE&I) issues. You cannot assume, for instance, that any action that results in a positive change against your goals will repeatedly have that same impact every time it’s applied.
Regularity accounts for how your numbers evolve, but benchmarking is needed to anchor your numbers to context.
DE&I has traditionally struggled in this area: a compliance team habitually looks at workforce availability data, but diversity and inclusion has to be more tactical about the external benchmarks it chooses. The data has to be applicable to your organization based on how you recruit and fill positions—more isn’t necessarily better. Potential sources of benchmark data include:
- US Census data
- Geographic data
- Industry data via the American Community Survey
- IPEDS (Integrated Postsecondary Education Data System)
Hand-picked for you: ‘4 Great Ways to Help Embed Diversity & Inclusion as a Priority in Your Organization’
The Importance of Drilling Down
One particular sticking point that organizations encounter is the amount of data they have on particular groups.
When working with statistics, we’re conditioned to be wary of small numbers—particularly valuing statistical significance. This causes organizations to make decisions based on higher-level groups, such as the experiences of all women or of people of color broadly.
This “one size fits all” approach to reviewing data can cause miscalculations, and may even hinder the progress of a DE&I strategy to increase diversity representation. Those at the intersection of different groups can easily be left behind. This is demonstrated by reports such as Women and Girls of Color in Computing, which highlights the “dearth of research on the specific experiences and outcomes of women of color along the computing pipeline”.
With, as the report suggests, just 2% of all employees at 177 Silicon Valley firms being Black, Latinx, or Native American/Alaskan Native women, these groups may well get rolled into larger overarching groups. But data on women collectively may dictate a direction that primarily benefits White women. Data on all people of color may yield benefits only for men of color.
The solution, as suggested in the Harvard Business Review, is to be willing to make claims based on small numbers, to not be afraid of granularity. It argues that small numbers are most problematic when working with samples of a full population—they are more meaningful when an organization has data on its full population. And when the number of employees really is too small to talk trends (when it’s just a single person, or no one at all), that’s “a data-point in itself”.
More on this topic: ‘Answering 11 Questions That Will Help You Use Data to Improve and Advance Your D&I Program’
Your Numbers and the Talent Cycle
According to a Glassdoor survey, two-thirds of job seekers say a diverse workforce is an important factor when evaluating companies and job offers. It also suggested that minority groups particularly value diversity—72% of women, 89% of Black respondents, 80% of Asians, and 70% of Latinos.
This reminds us that it’s imperative to know your diversity numbers in order to demonstrate where your organization currently is and where it’s going.
It also reminds us that hiring (and thereafter, promotion) are the parts of the talent cycle with the biggest impact. Writing in Entrepreneur, Kimberly Zhang talks about the need to “Cast your line where the fish are”. Meaning you’ll find skilled women on women’s college campuses or in professional organizations.
The organization should then take inspiration and internally provide Employee Resource Groups (ERG) in which the underrepresented can gather.
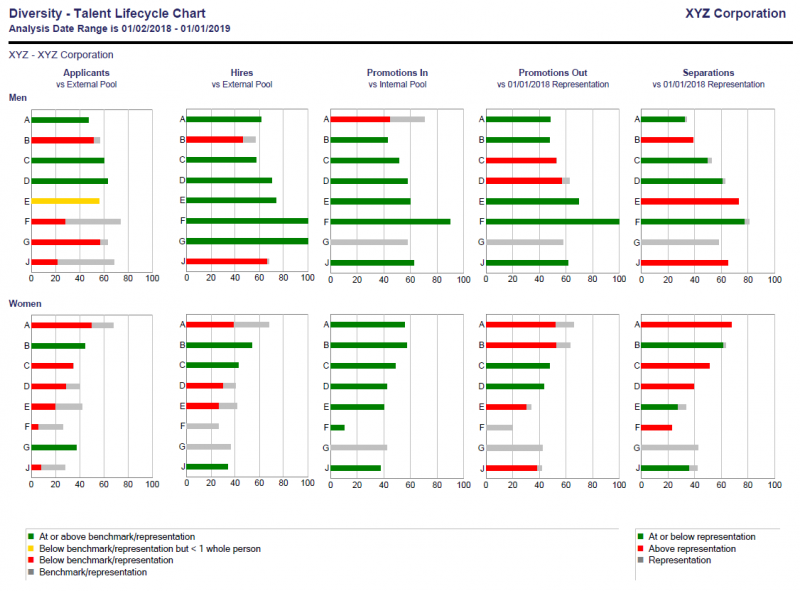
This commitment to a review of hiring, promotion, and termination is ongoing, and can be most easily monitored through workforce analytics software. For example, Affirmity’s Talent Lifecycle chart (shown above) is fed by HRIS and applicant tracking system data and provides per-demographic graphs for:
- Applicants (vs external pool)
- Hires (vs external pool)
- Promotions in (vs internal pool)
- Promotions out (vs representation from the beginning of the recorded period)
- Separations (vs representation from the beginning of the recorded period)
By graphing individual stages in the talent cycle and diversity groups, it’s easy to determine where in the process different groups are encountering issues. In the example, underperformance against expectations is graphed in red and yellow, prompting further investigation and correction.
A timely reminder from the blog: ‘5 Ways to Prepare for Your 2021 Affirmative Action and Diversity Initiatives’
Accelerating Your DE&I Program: Continue Reading
Topics also covered in our guide include:
- The importance of pay transparency and having a C-suite that practices what it preaches—and why the benefits of diverse leadership and visible pay equity are underrated.
- How to cultivate a culturally aware climate by embracing intersectionality and encouraging allyship
- The process of learning an inclusive language and making your DE&I training programs as widely accessible as possible
Download your copy of the guide today.
Are you making decisions that will transform your DE&I strategy? Contact our team for advice and solutions that will help you achieve your goals more quickly and effectively.